Gewinn/Verlust
Letzter Tag
Will the Iranian regime fall before 2027?
66¢
80.5¢
Will the Iranian regime fall before 2027?

Will the U.S. invade Iran before 2027?
61.9¢
68.5¢
Will the U.S. invade Iran before 2027?

US obtains Iranian enriched uranium by May 31?
75¢
77.5¢
US obtains Iranian enriched uranium by May 31?
Will the Iranian regime fall by June 30?
70.9¢
92.5¢
Will the Iranian regime fall by June 30?
Iran x Israel/US conflict ends by April 15?
26.5¢
85.5¢
Iran x Israel/US conflict ends by April 15?

US x Iran permanent peace deal by April 22, 2026?
22.3¢
23.5¢
US x Iran permanent peace deal by April 22, 2026?

Will Trump agree to Iranian enrichment of uranium in April?
27.5¢
34.3¢
Will Trump agree to Iranian enrichment of uranium in April?

Will France, UK, or Germany strike Iran by June 30?
66.8¢
94.6¢
Will France, UK, or Germany strike Iran by June 30?
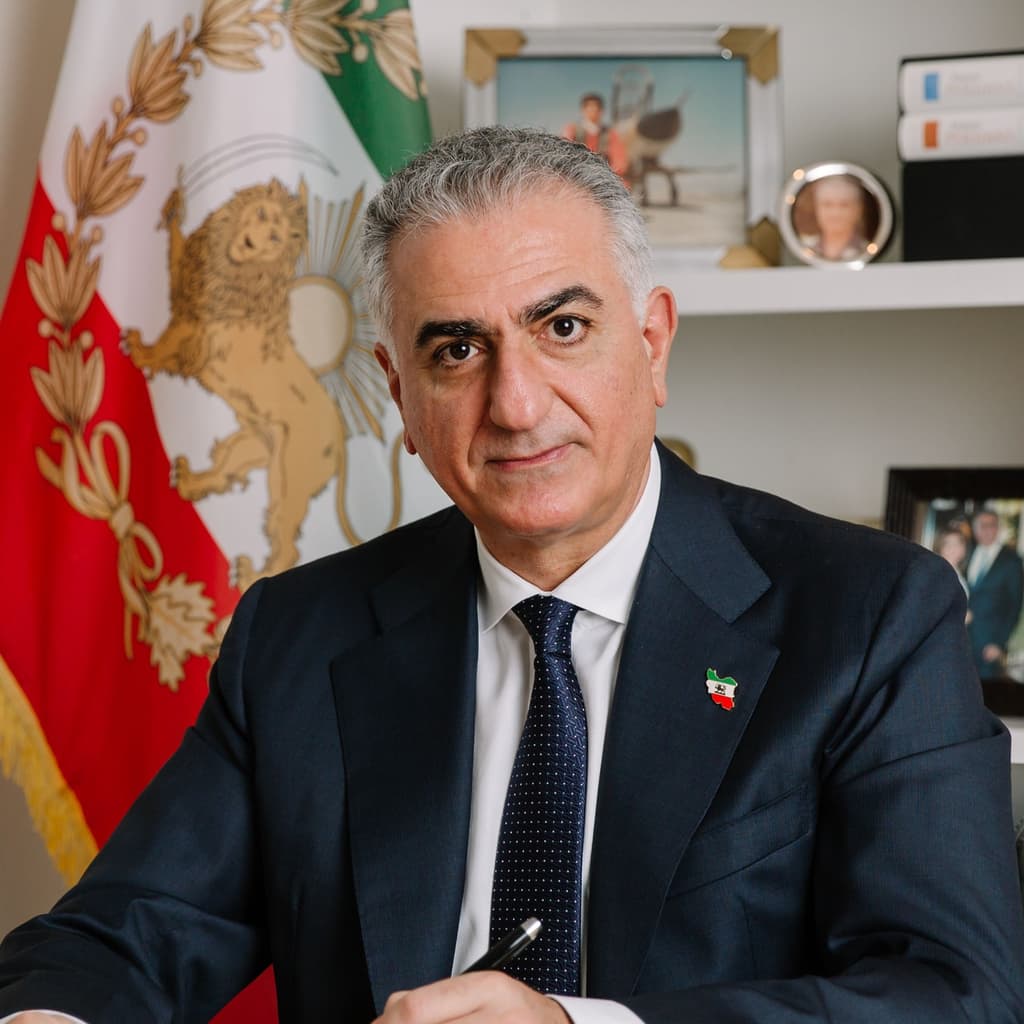
Will Reza Pahlavi enter Iran by June 30?
79.6¢
93.5¢
Will Reza Pahlavi enter Iran by June 30?
US x Iran permanent peace deal by April 30, 2026?
36.1¢
42.5¢
US x Iran permanent peace deal by April 30, 2026?
Will Reza Pahlavi enter Iran by December 31?
68.7¢
85.5¢
Will Reza Pahlavi enter Iran by December 31?
Iran agrees to surrender enriched uranium stockpile by April 30, 2026?
30.6¢
37¢
Iran agrees to surrender enriched uranium stockpile by April 30, 2026?
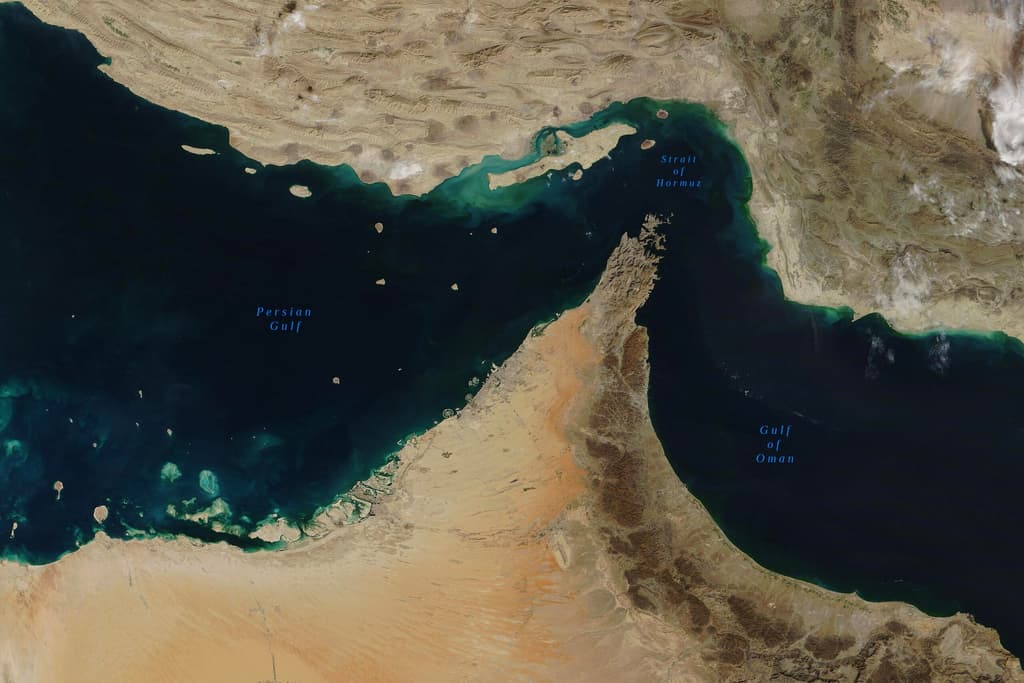
Strait of Hormuz traffic returns to normal by end of April?
38.1¢
26.5¢
Strait of Hormuz traffic returns to normal by end of April?

Israel withdraws from Lebanon by May 31, 2026?
88.8¢
91.5¢
Israel withdraws from Lebanon by May 31, 2026?
Israel withdraws from Lebanon by June 30, 2026?
81.3¢
84.5¢
Israel withdraws from Lebanon by June 30, 2026?
Iran agrees to end enrichment of uranium by April 30?
34.9¢
35.2¢
Iran agrees to end enrichment of uranium by April 30?

Will Nicolás Maduro be the leader of Venezuela end of 2026?
48.3¢
52.3¢
Will Nicolás Maduro be the leader of Venezuela end of 2026?

Iran coup attempt by June 30?

Trump announces end of military operations against Iran by April 21st?
22.6¢
10.5¢
Trump announces end of military operations against Iran by April 21st?
US obtains Iranian enriched uranium by December 31?
62.9¢
68.5¢
US obtains Iranian enriched uranium by December 31?

Will Mojtaba Khamenei be head of state in Iran end of 2026?
58.1¢
67.3¢
Will Mojtaba Khamenei be head of state in Iran end of 2026?

Iran leadership change by December 31?

US-Iran nuclear deal by April 30?
Iran agrees to end enrichment of uranium by June 30?
35.8¢
50¢
Iran agrees to end enrichment of uranium by June 30?

Israel and Syria normalize relations by June 30, 2026?
83.4¢
93.8¢
Israel and Syria normalize relations by June 30, 2026?

US x Iran ceasefire extended by April 21, 2026?
69.9¢
75.5¢
US x Iran ceasefire extended by April 21, 2026?
Will the Iranian regime fall by April 30?
Iran x Israel/US conflict ends by April 7?
17.3¢
14.5¢
Iran x Israel/US conflict ends by April 7?

Israel and Lebanon normalize relations before 2027?
73.8¢
76.5¢
Israel and Lebanon normalize relations before 2027?

Israel strike on Yemen by June 30, 2026?
62.1¢
73.5¢
Israel strike on Yemen by June 30, 2026?
Will the Iranian regime fall before 2027?
66¢
80.5¢
Will the Iranian regime fall before 2027?
Will the U.S. invade Iran before 2027?
61.9¢
68.5¢
Will the U.S. invade Iran before 2027?
US obtains Iranian enriched uranium by May 31?
75¢
77.5¢
US obtains Iranian enriched uranium by May 31?
Will the Iranian regime fall by June 30?
70.9¢
92.5¢
Will the Iranian regime fall by June 30?
Iran x Israel/US conflict ends by April 15?
26.5¢
85.5¢
Iran x Israel/US conflict ends by April 15?
US x Iran permanent peace deal by April 22, 2026?
22.3¢
23.5¢
US x Iran permanent peace deal by April 22, 2026?
Will Trump agree to Iranian enrichment of uranium in April?
27.5¢
34.3¢
Will Trump agree to Iranian enrichment of uranium in April?
Will France, UK, or Germany strike Iran by June 30?
66.8¢
94.6¢
Will France, UK, or Germany strike Iran by June 30?
Will Reza Pahlavi enter Iran by June 30?
79.6¢
93.5¢
Will Reza Pahlavi enter Iran by June 30?
US x Iran permanent peace deal by April 30, 2026?
36.1¢
42.5¢
US x Iran permanent peace deal by April 30, 2026?
Will Reza Pahlavi enter Iran by December 31?
68.7¢
85.5¢
Will Reza Pahlavi enter Iran by December 31?
Iran agrees to surrender enriched uranium stockpile by April 30, 2026?
30.6¢
37¢
Iran agrees to surrender enriched uranium stockpile by April 30, 2026?
Strait of Hormuz traffic returns to normal by end of April?
38.1¢
26.5¢
Strait of Hormuz traffic returns to normal by end of April?
Israel withdraws from Lebanon by May 31, 2026?
88.8¢
91.5¢
Israel withdraws from Lebanon by May 31, 2026?
Israel withdraws from Lebanon by June 30, 2026?
81.3¢
84.5¢
Israel withdraws from Lebanon by June 30, 2026?
Iran agrees to end enrichment of uranium by April 30?
34.9¢
35.2¢
Iran agrees to end enrichment of uranium by April 30?
Will Nicolás Maduro be the leader of Venezuela end of 2026?
48.3¢
52.3¢
Will Nicolás Maduro be the leader of Venezuela end of 2026?
Iran coup attempt by June 30?
Trump announces end of military operations against Iran by April 21st?
22.6¢
10.5¢
Trump announces end of military operations against Iran by April 21st?
US obtains Iranian enriched uranium by December 31?
62.9¢
68.5¢
US obtains Iranian enriched uranium by December 31?
Will Mojtaba Khamenei be head of state in Iran end of 2026?
58.1¢
67.3¢
Will Mojtaba Khamenei be head of state in Iran end of 2026?
Iran leadership change by December 31?
US-Iran nuclear deal by April 30?
Iran agrees to end enrichment of uranium by June 30?
35.8¢
50¢
Iran agrees to end enrichment of uranium by June 30?
Israel and Syria normalize relations by June 30, 2026?
83.4¢
93.8¢
Israel and Syria normalize relations by June 30, 2026?
US x Iran ceasefire extended by April 21, 2026?
69.9¢
75.5¢
US x Iran ceasefire extended by April 21, 2026?
Will the Iranian regime fall by April 30?
Iran x Israel/US conflict ends by April 7?
17.3¢
14.5¢
Iran x Israel/US conflict ends by April 7?
Israel and Lebanon normalize relations before 2027?
73.8¢
76.5¢
Israel and Lebanon normalize relations before 2027?
Israel strike on Yemen by June 30, 2026?
62.1¢
73.5¢
Israel strike on Yemen by June 30, 2026?