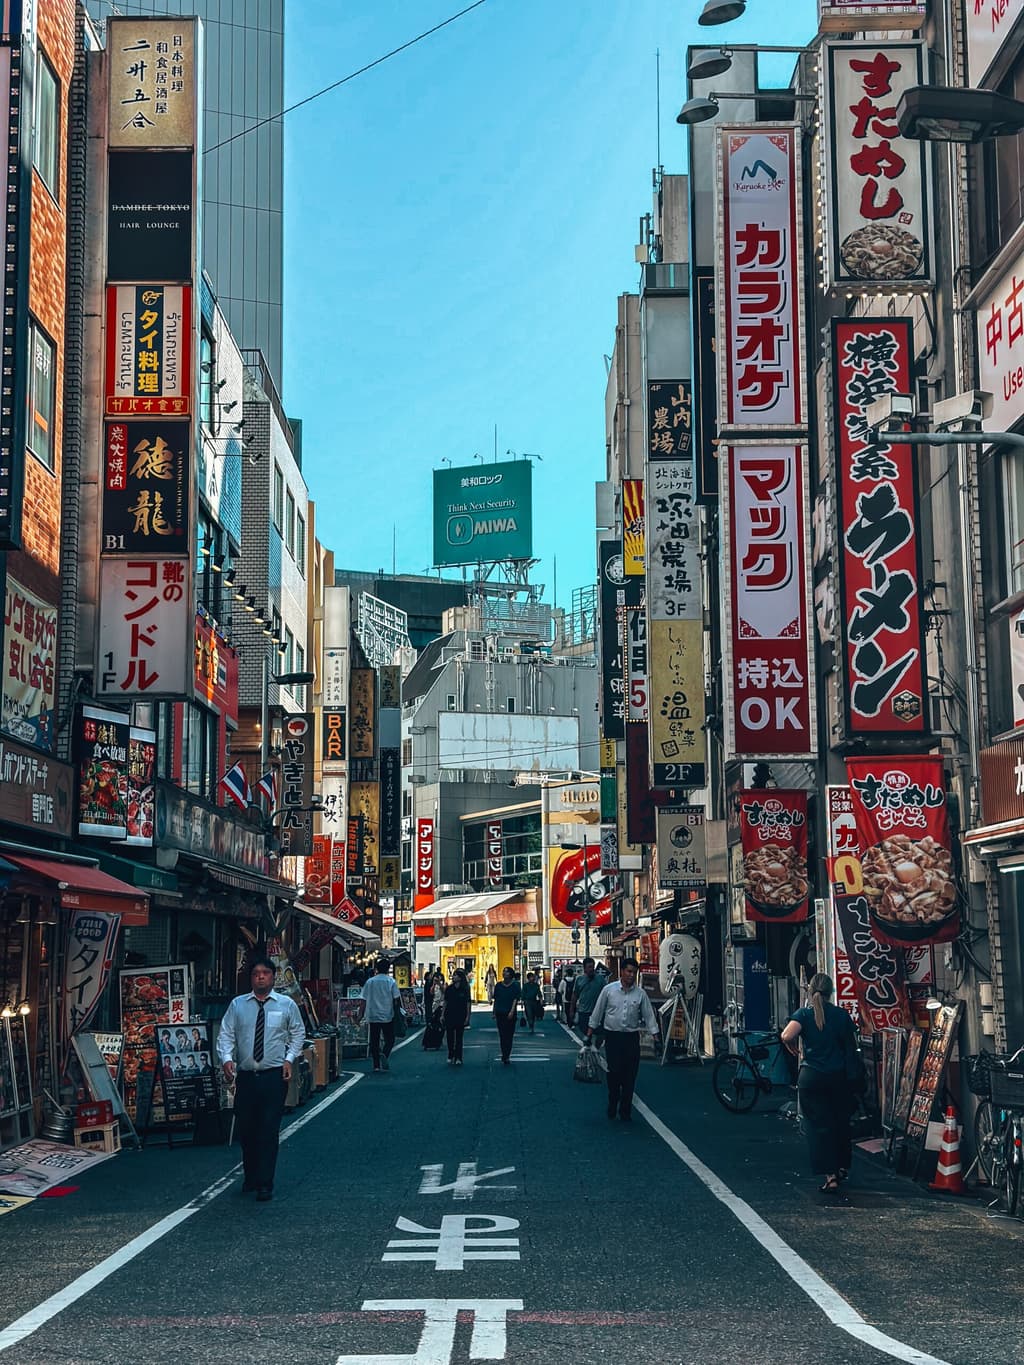
Recent Japan Meteorological Agency forecasts indicate mostly cloudy conditions over Tokyo on August 1 amid an ongoing heatwave, with daytime maxima in the mid-to-upper 30s Celsius likely driven by southerly flow and high humidity that limits nighttime cooling. Model consensus from late July shows temperatures building from 36–37°C on July 31, placing the highest probability near 35°C while leaving room for modest day-to-day variability depending on cloud cover and any localized sea-breeze effects. Historical climatology for early August supports occasional peaks above 35°C but rarely sustained extremes without clear skies or specific synoptic patterns, explaining why the market clusters tightly around 34–36°C rather than favoring either tail. Updated JMA guidance and refined model runs over the next 48 hours will be the key near-term catalysts for any shifts in implied probabilities.
Ringkasan eksperimental yang dihasilkan AI dengan referensi data Polymarket. Ini bukan saran trading dan tidak berperan dalam bagaimana pasar ini diselesaikan. · DiperbaruiHighest temperature in Tokyo on August 1?
Highest temperature in Tokyo on August 1?
35°C 30%
36°C 24%
34°C 21%
37°C 16%
29°C or below
<1%
30°C
<1%
31°C
1%
32°C
3%
33°C
7%
34°C
21%
35°C
30%
36°C
24%
37°C
16%
38°C
5%
39°C or higher
<1%
35°C 30%
36°C 24%
34°C 21%
37°C 16%
29°C or below
<1%
30°C
<1%
31°C
1%
32°C
3%
33°C
7%
34°C
21%
35°C
30%
36°C
24%
37°C
16%
38°C
5%
39°C or higher
<1%
The resolution source for this market will be information from Wunderground, specifically the highest temperature recorded for all times on this day for the Tokyo Haneda Airport Station, available here: https://www.wunderground.com/history/daily/jp/tokyo/RJTT.
To toggle between Fahrenheit and Celsius, click the gear icon next to the search bar and switch the Temperature setting between °F and °C.
This market can not resolve until the first data point for the following date has been published on the resolution source.
The resolution source for this market measures temperatures to whole degrees Celsius (eg, 9°C). Thus, this is the level of precision that will be used when resolving the market.
Revisions to temperatures recorded within this market's timeframe will be considered until the first datapoint for the following date has been published, after which any alterations will not be considered.
Pasar Dibuka: Jul 30, 2026, 12:02 AM ET
Sumber Resolusi
https://www.wunderground.com/history/daily/jp/tokyo/RJTTResolver
0x69c47De9D...The resolution source for this market will be information from Wunderground, specifically the highest temperature recorded for all times on this day for the Tokyo Haneda Airport Station, available here: https://www.wunderground.com/history/daily/jp/tokyo/RJTT.
To toggle between Fahrenheit and Celsius, click the gear icon next to the search bar and switch the Temperature setting between °F and °C.
This market can not resolve until the first data point for the following date has been published on the resolution source.
The resolution source for this market measures temperatures to whole degrees Celsius (eg, 9°C). Thus, this is the level of precision that will be used when resolving the market.
Revisions to temperatures recorded within this market's timeframe will be considered until the first datapoint for the following date has been published, after which any alterations will not be considered.
Sumber Resolusi
https://www.wunderground.com/history/daily/jp/tokyo/RJTTResolver
0x69c47De9D...Recent Japan Meteorological Agency forecasts indicate mostly cloudy conditions over Tokyo on August 1 amid an ongoing heatwave, with daytime maxima in the mid-to-upper 30s Celsius likely driven by southerly flow and high humidity that limits nighttime cooling. Model consensus from late July shows temperatures building from 36–37°C on July 31, placing the highest probability near 35°C while leaving room for modest day-to-day variability depending on cloud cover and any localized sea-breeze effects. Historical climatology for early August supports occasional peaks above 35°C but rarely sustained extremes without clear skies or specific synoptic patterns, explaining why the market clusters tightly around 34–36°C rather than favoring either tail. Updated JMA guidance and refined model runs over the next 48 hours will be the key near-term catalysts for any shifts in implied probabilities.
Ringkasan eksperimental yang dihasilkan AI dengan referensi data Polymarket. Ini bukan saran trading dan tidak berperan dalam bagaimana pasar ini diselesaikan. · Diperbarui

Hati-hati dengan link eksternal.
Hati-hati dengan link eksternal.
Pertanyaan yang Sering Diajukan