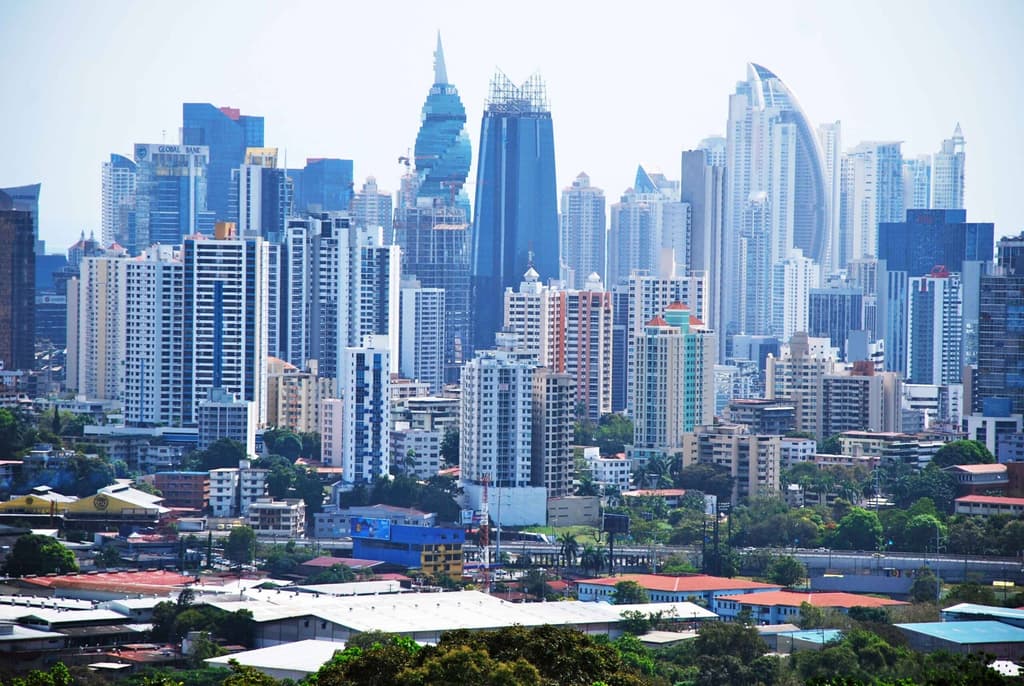
Trader consensus around 31°C as the modal outcome for Panama City on July 3 reflects the city's July climatology, with average daily highs near 30–31°C and a typical range of 29–32°C amid the rainy season. Recent model guidance shows limited day-to-day variability, but scattered afternoon convection, variable cloud cover, and moisture from the Intertropical Convergence Zone can suppress or elevate maxima by 1–2°C. The broad distribution across 30–32°C outcomes underscores genuine uncertainty in short-range forecasts, where small shifts in timing or intensity of showers alter peak readings. Historical analogs indicate occasional 33°C+ spikes under clearer conditions, while persistent cloudiness favors the lower tail. Final model runs and local observations over the next 24 hours remain the key variables for traders.
Experimental AI-generated summary referencing Polymarket data. This is not trading advice and plays no role in how this market resolves. · UpdatedHighest temperature in Panama City on July 3?
Highest temperature in Panama City on July 3?
32°C 100.0%
23°C or below <1%
24°C <1%
25°C <1%
$35,470 Vol.
$35,470 Vol.
23°C or below
No
24°C
No
25°C
No
26°C
No
27°C
No
28°C
No
29°C
No
30°C
No
31°C
No
32°C
Yes
33°C or higher
No
32°C 100.0%
23°C or below <1%
24°C <1%
25°C <1%
$35,470 Vol.
$35,470 Vol.
23°C or below
No
24°C
No
25°C
No
26°C
No
27°C
No
28°C
No
29°C
No
30°C
No
31°C
No
32°C
Yes
33°C or higher
No
The resolution source for this market will be information from Wunderground, specifically the highest temperature recorded for all times on this day for the Marcos A. Gelabert Intl Airport Station, available here: https://www.wunderground.com/history/daily/pa/panama-city/MPMG.
To toggle between Fahrenheit and Celsius, click the gear icon next to the search bar and switch the Temperature setting between °F and °C.
This market can not resolve until the first data point for the following date has been published on the resolution source.
The resolution source for this market measures temperatures to whole degrees Celsius (eg, 9°C). Thus, this is the level of precision that will be used when resolving the market.
Revisions to temperatures recorded within this market's timeframe will be considered until the first datapoint for the following date has been published, after which any alterations will not be considered.
Market Opened: Jul 1, 2026, 10:03 PM ET
Resolution Source
https://www.wunderground.com/history/daily/pa/panama-city/MPMGResolver
0x69c47De9D...Outcome proposed: No
No dispute
Final outcome: No
The resolution source for this market will be information from Wunderground, specifically the highest temperature recorded for all times on this day for the Marcos A. Gelabert Intl Airport Station, available here: https://www.wunderground.com/history/daily/pa/panama-city/MPMG.
To toggle between Fahrenheit and Celsius, click the gear icon next to the search bar and switch the Temperature setting between °F and °C.
This market can not resolve until the first data point for the following date has been published on the resolution source.
The resolution source for this market measures temperatures to whole degrees Celsius (eg, 9°C). Thus, this is the level of precision that will be used when resolving the market.
Revisions to temperatures recorded within this market's timeframe will be considered until the first datapoint for the following date has been published, after which any alterations will not be considered.
Resolution Source
https://www.wunderground.com/history/daily/pa/panama-city/MPMGResolver
0x69c47De9D...Outcome proposed: No
No dispute
Final outcome: No
Trader consensus around 31°C as the modal outcome for Panama City on July 3 reflects the city's July climatology, with average daily highs near 30–31°C and a typical range of 29–32°C amid the rainy season. Recent model guidance shows limited day-to-day variability, but scattered afternoon convection, variable cloud cover, and moisture from the Intertropical Convergence Zone can suppress or elevate maxima by 1–2°C. The broad distribution across 30–32°C outcomes underscores genuine uncertainty in short-range forecasts, where small shifts in timing or intensity of showers alter peak readings. Historical analogs indicate occasional 33°C+ spikes under clearer conditions, while persistent cloudiness favors the lower tail. Final model runs and local observations over the next 24 hours remain the key variables for traders.
Experimental AI-generated summary referencing Polymarket data. This is not trading advice and plays no role in how this market resolves. · Updated
Beware of external links.
Beware of external links.
Frequently Asked Questions