Gewinn/Verlust
Letzter Tag

Will the U.S. invade Iran before 2027?
70.7¢
85.5¢
Will the U.S. invade Iran before 2027?
Will the Iranian regime fall before 2027?
66.1¢
90.5¢
Will the Iranian regime fall before 2027?

Israel withdraws from Lebanon by June 30, 2026?
90.5¢
99.8¢
Israel withdraws from Lebanon by June 30, 2026?

Will France, UK, or Germany strike Iran by June 30?
79.7¢
99.9¢
Will France, UK, or Germany strike Iran by June 30?

US-Iran Final Nuclear Deal by August 31, 2026?
73.7¢
75.5¢
US-Iran Final Nuclear Deal by August 31, 2026?
Iran agrees to surrender enriched uranium stockpile by July 31, 2026?
93.2¢
97.4¢
Iran agrees to surrender enriched uranium stockpile by July 31, 2026?
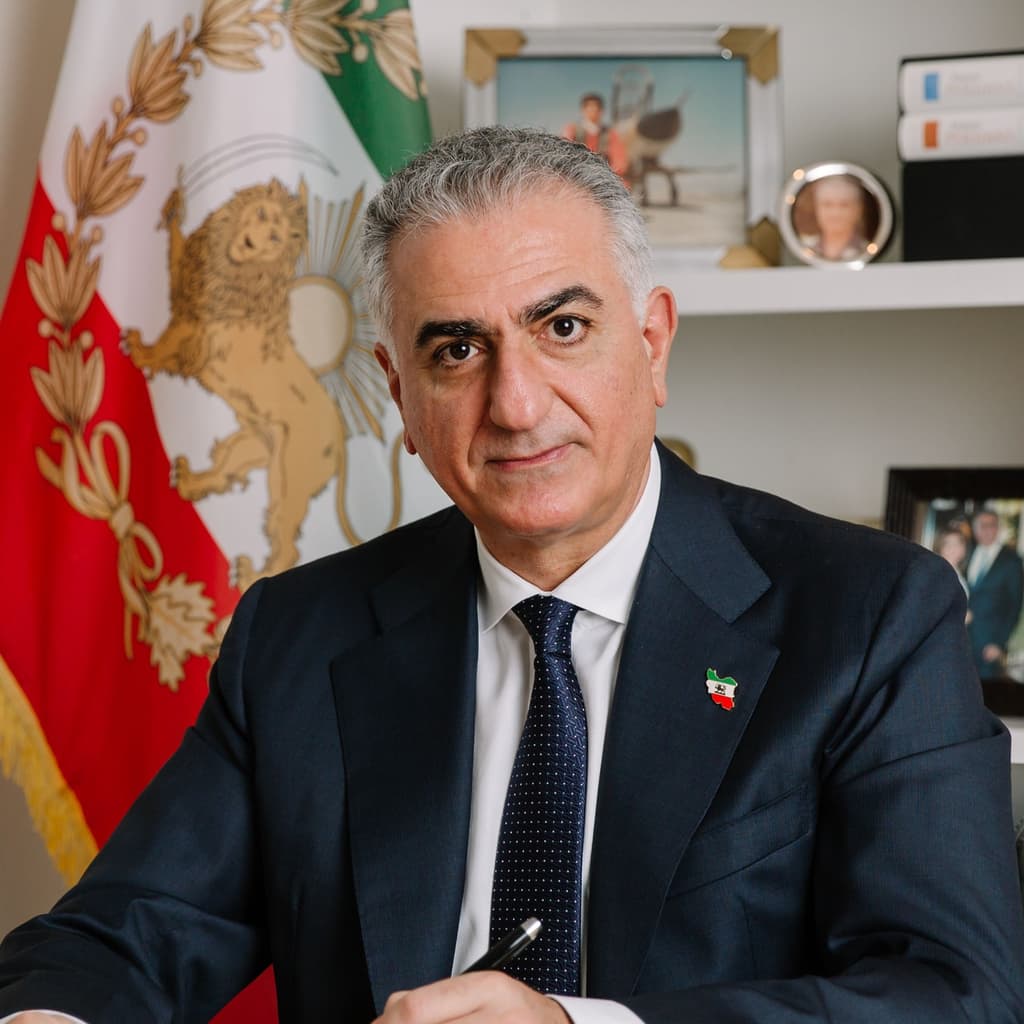
Will Reza Pahlavi enter Iran by December 31?
74.3¢
93.5¢
Will Reza Pahlavi enter Iran by December 31?
Israel withdraws from Lebanon by July 31, 2026?
87.3¢
96.6¢
Israel withdraws from Lebanon by July 31, 2026?
Iran agrees to surrender enriched uranium stockpile by June 30, 2026?
95.6¢
99.5¢
Iran agrees to surrender enriched uranium stockpile by June 30, 2026?

US obtains Iranian enriched uranium by December 31?
75.6¢
87.5¢
US obtains Iranian enriched uranium by December 31?

Will Nicolás Maduro be the leader of Venezuela end of 2026?
51.2¢
80.9¢
Will Nicolás Maduro be the leader of Venezuela end of 2026?

Israel closes its airspace by June 30?
Will Reza Pahlavi enter Iran by June 30?
80.1¢
100¢
Will Reza Pahlavi enter Iran by June 30?

Iran leadership change by June 30?
Iran leadership change by December 31?
64.7¢
84.5¢
Iran leadership change by December 31?

Will Mojtaba Khamenei be head of state in Iran end of 2026?
62.1¢
84.6¢
Will Mojtaba Khamenei be head of state in Iran end of 2026?

Iran coup attempt by June 30?
US-Iran Final Nuclear Deal by July 31, 2026?
93.8¢
96.4¢
US-Iran Final Nuclear Deal by July 31, 2026?

Will Spencer Pratt win the 2026 Los Angeles mayoral election?
76.2¢
99.4¢
Will Spencer Pratt win the 2026 Los Angeles mayoral election?

Nothing Ever Happens: 2026