Trader consensus favors severely curtailed maritime traffic through the Strait of Hormuz, with 0-10 daily ships at 25.5% and 10-20 at 20.8%, reflecting a collapse from pre-conflict averages of 100-140 vessels per day amid the ongoing US-Iran war that erupted February 28, 2026. Recent US naval blockade enforcement since April 13 has blocked non-Iranian commercial vessels, while Iran permits only select Iran-linked or sanctioned tankers, yielding single-digit transits daily per ship-tracking data like IMF PortWatch—down over 90% from norms. Fragile ceasefire talks and persistent threats sustain caution among shippers facing elevated risks and insurance costs, keeping low bins tightly contested. Escalation via attacks or tightened controls could drop volumes to zero; diplomatic breakthroughs allowing broader access might push toward 20-30, per historical recovery patterns post-chokepoint crises.
Polymarket verilerine atıfta bulunan deneysel AI tarafından oluşturulmuş özet. Bu bir işlem tavsiyesi değildir ve bu piyasanın nasıl çözümlendiğinde hiçbir rolü yoktur. · GüncellendiNisan ayı sonunda Hürmüz Boğazı'ndan geçen ortalama gemi sayısı?
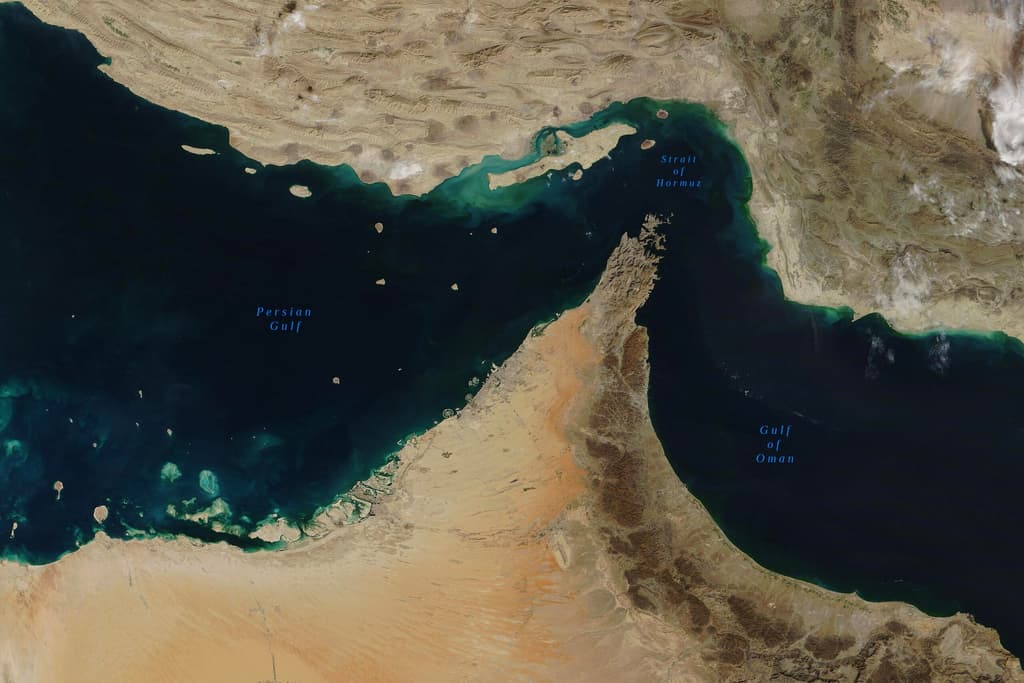
Nisan ayı sonunda Hürmüz Boğazı'ndan geçen ortalama gemi sayısı?
0-10 26%
10-20 20.7%
60+ 14%
50-60 9.2%
$103,381 Hac.
$103,381 Hac.
0-10
26%
10-20
21%
20-30
9%
30-40
8%
40-50
6%
50-60
9%
60+
14%
0-10 26%
10-20 20.7%
60+ 14%
50-60 9.2%
$103,381 Hac.
$103,381 Hac.
0-10
26%
10-20
21%
20-30
9%
30-40
8%
40-50
6%
50-60
9%
60+
14%
Transit calls include container, dry bulk, roll-on/roll-off, general cargo, and tanker ships. Ships not reported by IMF Portwatch will not be considered.
This market will resolve as soon as data for the specified date has been published. If no data for the specified date has been published by May 14, 2026, 11:59 PM ET, this market will resolve based on data for the most recent date prior to April 30, 2026, for which data is available.
This market will resolve based on the first publication of data for April 30, 2026. Any subsequent revisions will not be considered.
If the reported value falls exactly between two brackets, this market will resolve to the higher range bracket.
The resolution source for this market will be IMF Portwatch, specifically the transit calls data published for the Strait of Hormuz at https://portwatch.imf.org/pages/cb5856222a5b4105adc6ee7e880a1730, both in the chart and through downloadable files.
Piyasa Açıldı: Mar 24, 2026, 1:00 PM ET
Resolver
0x69c47De9D...Transit calls include container, dry bulk, roll-on/roll-off, general cargo, and tanker ships. Ships not reported by IMF Portwatch will not be considered.
This market will resolve as soon as data for the specified date has been published. If no data for the specified date has been published by May 14, 2026, 11:59 PM ET, this market will resolve based on data for the most recent date prior to April 30, 2026, for which data is available.
This market will resolve based on the first publication of data for April 30, 2026. Any subsequent revisions will not be considered.
If the reported value falls exactly between two brackets, this market will resolve to the higher range bracket.
The resolution source for this market will be IMF Portwatch, specifically the transit calls data published for the Strait of Hormuz at https://portwatch.imf.org/pages/cb5856222a5b4105adc6ee7e880a1730, both in the chart and through downloadable files.
Resolver
0x69c47De9D...Trader consensus favors severely curtailed maritime traffic through the Strait of Hormuz, with 0-10 daily ships at 25.5% and 10-20 at 20.8%, reflecting a collapse from pre-conflict averages of 100-140 vessels per day amid the ongoing US-Iran war that erupted February 28, 2026. Recent US naval blockade enforcement since April 13 has blocked non-Iranian commercial vessels, while Iran permits only select Iran-linked or sanctioned tankers, yielding single-digit transits daily per ship-tracking data like IMF PortWatch—down over 90% from norms. Fragile ceasefire talks and persistent threats sustain caution among shippers facing elevated risks and insurance costs, keeping low bins tightly contested. Escalation via attacks or tightened controls could drop volumes to zero; diplomatic breakthroughs allowing broader access might push toward 20-30, per historical recovery patterns post-chokepoint crises.
Polymarket verilerine atıfta bulunan deneysel AI tarafından oluşturulmuş özet. Bu bir işlem tavsiyesi değildir ve bu piyasanın nasıl çözümlendiğinde hiçbir rolü yoktur. · Güncellendi
Harici bağlantılara dikkat edin.
Harici bağlantılara dikkat edin.
Sıkça Sorulan Sorular